 Washington, D.C. – In 2012, there were 905 natural catastrophes worldwide, 93 percent of which were weather-related disasters. In terms of overall and insured losses (US $ 170 billion and $ 70 billion, respectively), 2012 did not follow the records set in 2011 and could be defined as a moderate year on a global scale. But the United States was seriously affected by weather extremes, accounting for 69 percent of overall losses and 92 percent of insured losses due to natural catastrophes worldwide, writes Petra Löw, a geographer and consultant at Munich Reinsurance Company, in the Worldwatch Institute’s Vital Signs Online service.
Of the 905 documented loss events, 45 percent were meteorological events (storms), 36 percent were hydrological events (floods), and 12 percent were climatological events such as heatwaves, cold waves, droughts, and wildfires. The remaining 7 percent were geophysical events – earthquakes and volcanic eruptions. This distribution deviates somewhat from long-term trends, as between 1980 and 2011 geophysical events accounted for 14 percent of all natural catastrophes.
Deaths during natural catastrophes in 2012 stood at 9,600 – substantially below the 10-year annual average of 106,000. The percentage distribution of fatalities in the four recognized event categories – meteorological, hydrological, climatological, and geophysical events – also differed in 2012. Only 7 percent of the deaths were caused by geophysical events, compared with the long-term average since 1980 of 40 percent. In contrast, 93 percent of the fatalities in 2012 were caused by weather-related events.
Some two-thirds of the global overall losses and 92 percent of the insured losses in 2012 were due to weather-related events in the United States. Hurricane Sandy, the summer-long drought in the Midwest, and severe storms with tornadoes accounted for $ 100 billion of the overall losses. The insurance industry covered $ 58 billion of this. These losses were the second highest overall and insured losses since 1980 in the United States. The most expensive year in the United States was 2005, when Hurricane Katrina hit the coast of Mississippi and the city of New Orleans. The rest of the 2012 overall losses occurred in Europe (13 percent) and the Asia-Pacific region (17 percent). The insured losses for these two regions were well below the average and accounted for 8 percent of the total.
Around 59 percent of overall losses in 2012 are attributable to storms, compared with the long-term average of 39 percent. Earthquakes accounted for 12 percent of overall losses, but that was only half the 1980-2011 average.
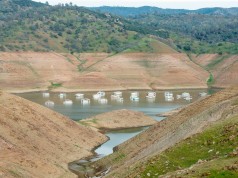
“With regard to insured losses, a particularly striking feature in the climatological events category was that droughts accounted for 28 percent,” said Löw. “This is well above the long-term average of 7 percent and was due to the severe drought that primarily afflicted the U.S. Midwest during the year, causing immense agricultural losses.”
In 2012, some 15 percent of global natural catastrophes occurred in Europe. The southern part of Europe was affected by drought conditions, especially parts of Italy, Spain, Portugal, Croatia, Bosnia and Herzegovina, Serbia, and Slovenia, with a total of $ 3.8 billion in overall losses. Also, severe dry conditions affected parts of Russia and Kazakhstan with agricultural losses reaching $ 600 million for Russia alone.
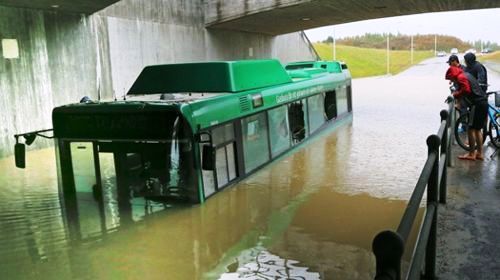
Some 11 percent of natural catastrophes happened in Africa, slightly above the long-term average of 9 percent. All of these events in 2012 were weather-related. A severe flood hit Nigeria from July to October – one of the five deadliest events in 2012 – causing overall losses of $ 500 million and killing 360 people.
The Asia-Pacific region accounted for 43 percent of all natural catastrophes worldwide in 2012. Only 17 percent of overall losses came from Asia-Pacific – well below the long-term average of 45 percent since 1980, with most of the events being floods and storms.
In terms of trends in natural catastrophes over the long term, Munich Reinsurance Company’s NatCatSERVICE documents about 21,000 loss events worldwide from 1980 to 2012. Some 13 percent of these events were geophysical, such as earthquakes, tsunamis, and volcanic eruptions. But 87 percent were weather-related: meteorological (39 percent), hydrological (35 percent), or climatological (13 percent) events. Since 1980, geophysical events have been more or less stable, whereas weather-related events have increased 2.8- to 3.6-fold.
Further highlights from the report:
- Some 37 percent of natural catastrophes occurred in Asia, 26 percent in the United States, 15 percent in Europe, 11 percent in Africa, and 6 percent in Australia/Oceania.
- Just 5 percent of natural catastrophes in 2012 affected South America, and 86 percent of these were weather-related events.
- The drought that affected the U.S. Midwest in the summer of 2012was responsible for overall losses of $ 20 billion.
Check the following link to read/download the Full Report:
http://vitalsigns.worldwatch.org/vs-trend/natural-catastrophes-2012-dominated-us-weather-extremes
Source: Worldwatch Institute.
About the Worldwatch Institute
Worldwatch Institute is an independent research organization based in Washington, D.C., that works on energy, resource, and environmental issues. The Institute’s State of the World report is published annually in more than a dozen languages. For more information, visit www.worldwatch.org.
About Vital Signs Online
Vital Signs Online provides business leaders, policymakers, and engaged citizens with the latest data and analysis they need to understand critical global trends. It is an interactive, subscription-based tool that provides hard data and research-based insights on the sustainability trends that are shaping our future. All of the trends include clear analysis and are placed in historical perspective, allowing you to see where the trend has come from and where it might be headed. New trends cover emerging hot topics – from global carbon emissions to green jobs – while trend updates provide the latest data and analysis for the fastest changing and most important trends today. Every trend includes full datasets and complete referencing.


