Friday, April 26, 2024
Home Blog

How Darkness And Cold Killed The Dinosaurs

Tyrannosaurus Rex “Tristan”, on display at the Museum für Naturkunde – Leibniz Institute for Evolution and Biodiversity Science in Berlin with which PIK is cooperating. Photo: Carola Radke/Museum für Naturkunde

PIK-POTSDAM: 66 million years ago, the sudden extinction of the dinosaurs started the ascent of the mammals, ultimately resulting in humankind’s reign on Earth. Climate scientists now reconstructed how tiny droplets of sulfuric acid formed high up in the air after the well-known impact of a large asteroid and blocking the sunlight for several years, had a profound influence on life on Earth. Plants died, and death spread through the food web. Previous theories focused on the shorter-lived dust ejected by the impact. The new computer simulations show that the droplets resulted in long-lasting cooling, a likely contributor to the death of land-living dinosaurs. An additional kill mechanism might have been a vigorous mixing of the oceans, caused by the surface cooling, severely disturbing marine ecosystems.

“The big chill following the impact of the asteroid that formed the Chicxulub crater in Mexico is a turning point in Earth history,” says Julia Brugger from the Potsdam Institute for Climate Impact Research (PIK), lead author of the study published in the Geophysical Research Letters. “We can now contribute new insights for understanding the much debated ultimate cause for the demise of the dinosaurs at the end of the Cretaceous period.” To investigate the phenomenon, the scientists for the first time used a specific kind of computer simulation normally applied in different contexts, a climate model coupling atmosphere, ocean and sea ice. They build on research showing that sulfur-bearing gases that evaporated from the violent asteroid impact on our planet’s surface were the main factor for blocking the sunlight and cooling down Earth.

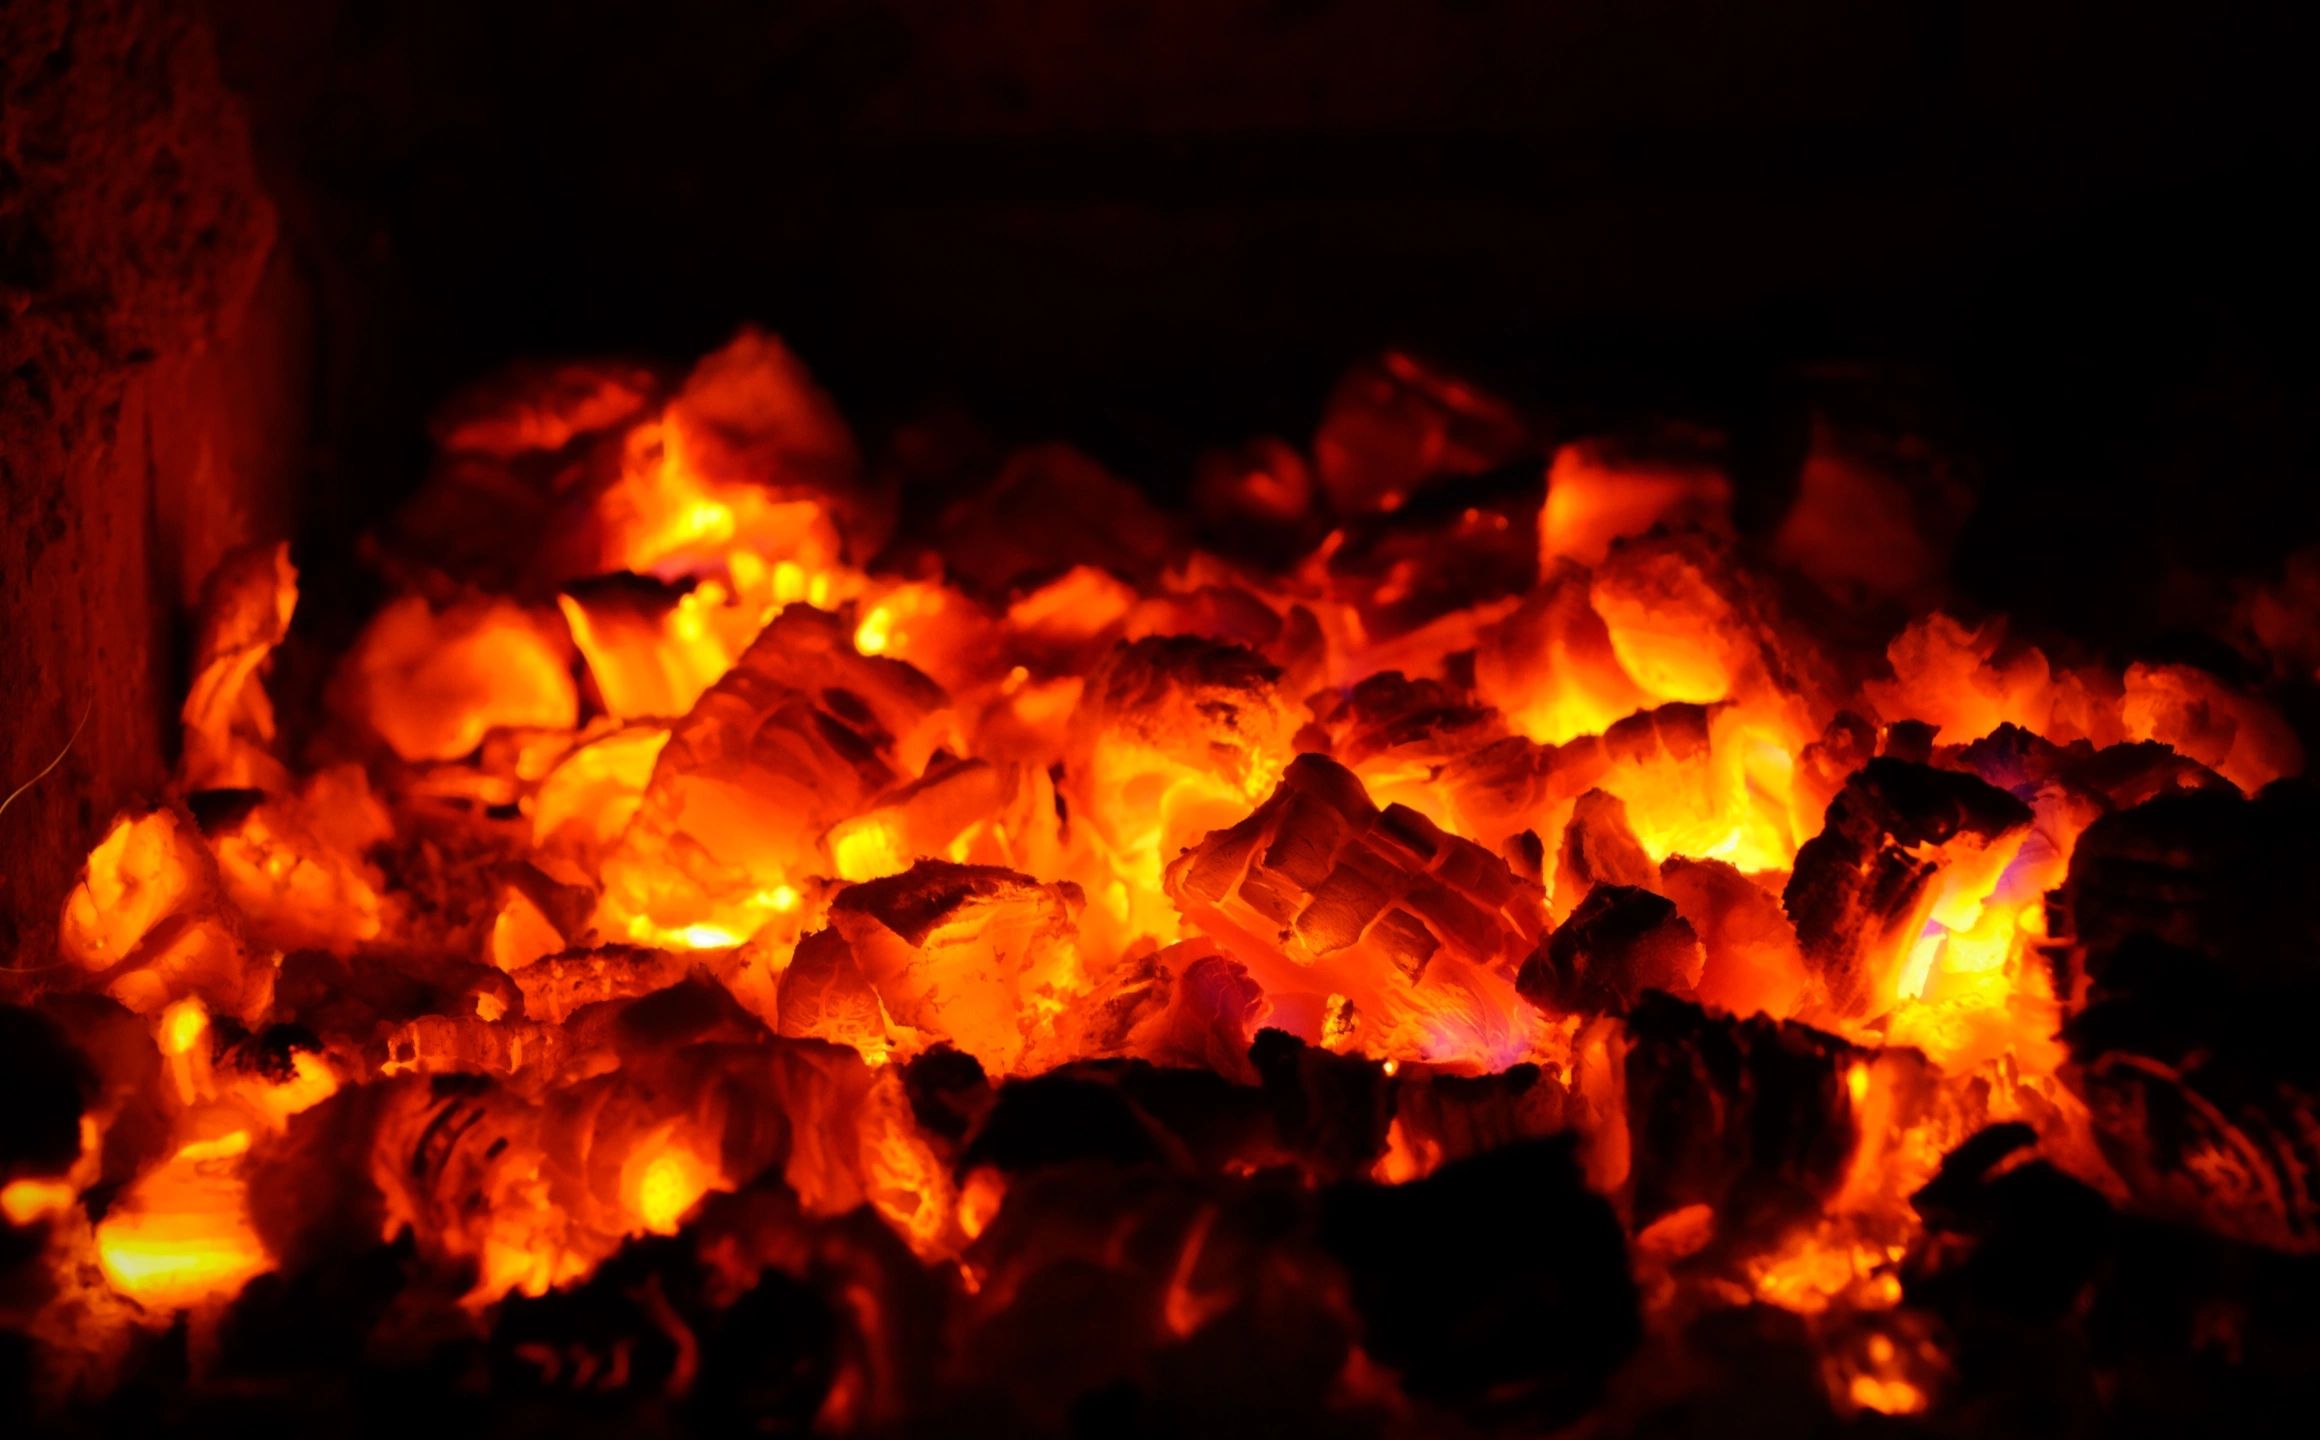
In the tropics, continental annual mean temperatures fell from 27 to -22 degrees Celsius

“It became cold, I mean, really cold,” says Brugger. Global annual mean surface air temperature dropped by at least 26 degrees Celsius. The dinosaurs were used to living in a lush climate. After the asteroid’s impact, the annual average temperature was below freezing point for about 3 years. Evidently, the ice caps expanded. Even in the tropics, continental annual mean temperatures went from 27 degrees to mere -22 degrees. “The long-term cooling caused by the sulfate aerosols was much more important for the mass extinction than the dust that stays in the atmosphere for only a relatively short time. It was also more important than local events like the extreme heat close to the impact, wildfires or tsunamis,” says co-author Georg Feulner who leads the research team at PIK. It took the climate about 30 years to recover, the scientists found.

In addition to this, ocean circulation became disturbed. Surface waters cooled down, thereby becoming denser and hence heavier. While these cooler water masses sank into the depths, warmer water from deeper ocean layers rose to the surface, carrying nutrients that likely led to massive blooms of algae, the scientists argue. It is conceivable that these algal blooms produced toxic substances, further affecting life at the coasts. Yet in any case, marine ecosystems were severely shaken up, and this likely contributed to the extinction of species in the oceans, like the ammonites.

“It illustrates how important the climate is for all lifeforms on our planet”

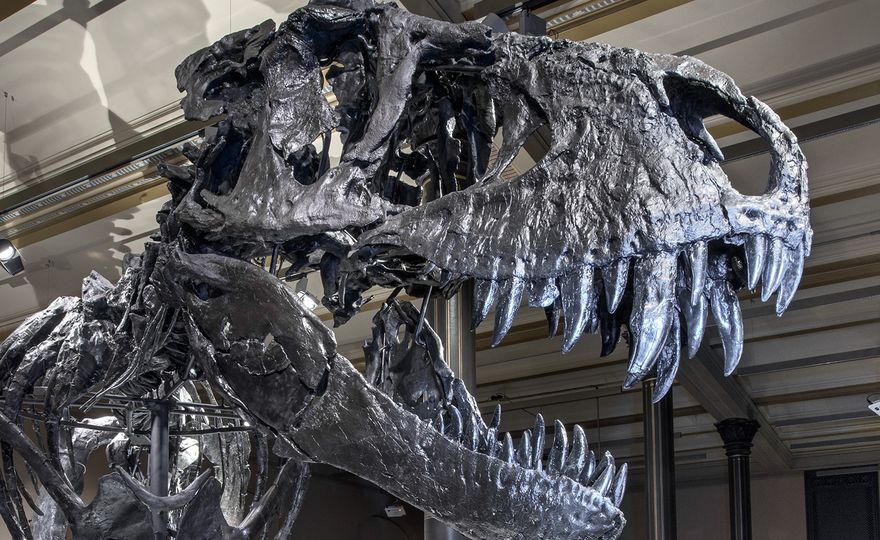
The dinosaurs, until then the masters of the Earth, made space for the rise of the mammals, and eventually humankind. The study of Earth’s past also shows that efforts to study future threats by asteroids have more than just academic interest. “It is fascinating to see how evolution is partly driven by an accident like an asteroid’s impact – mass extinctions show that life on Earth is vulnerable,” says Feulner. “It also illustrates how important the climate is for all lifeforms on our planet. Ironically today, the most immediate threat is not from natural cooling but from human-made global warming.”

Uneconomic Plants Contribute 20 Percent of US Coal-Fired Electricity

WASHINGTON (Union of Concerned Scientists)—Despite political rhetoric to the contrary and recent actions by the Trump administration, the market reality is that coal-fired power has become increasingly uneconomic and is the main factor driving the U.S. electricity sector to rapidly transition away from coal. Of the more than 700 coal units operating in the U.S. in 2016, 163 units that produce 13 percent of all coal-fired electricity generation are already scheduled for closure or conversion to natural gas. A new study by the Union of Concerned Scientists (UCS), A Dwindling Role for Coal,” finds that an additional 19 percent of coal-fired generation produced by 122 units are uncompetitive as compared to cleaner alternatives. The analysis identifies which units are no longer economic and may face retirement, features four snapshots of communities located near coal plants, and cautions states against a potentially risky wholesale shift away from coal to natural gas.

The transition away from coal has resulted in a significant boon to public health nationwide. For example, the number of people living close to an operating coal plant—which is made up of individual coal units—plummeted in the last decade. In 2008, approximately 8.5 million people lived within a 3-mile radius of an operational coal plant, but by 2016, following widespread coal plant retirements, that number fell to about 3.3 million. Taking in to account the coal plants that have announced plans to retire, the number drops to less than 2 million. If utilities opted to retire all the units classified as uneconomic in the analysis, the number falls further still to roughly 1.5 million.

“Our analysis shows that the transition away from coal over the past decade is poised to continue—thanks primarily to market forces,” said Jeremy Richardson, senior energy analyst at UCS and lead author of the analysis. “Without factoring the cost of installing missing modern pollution controls into the calculations, a large portion of today’s coal fleet can’t compete economically with cleaner energy options, such as natural gas and, in some cases, renewables. This is particularly true in the Southeast where most coal units operate at a higher cost than cleaner energy options, causing them to fail our economic stress test.”

While a total of 20 states have coal units that are no longer economic, the five states that are facing the greatest amount of uneconomic coal generation relative to their overall electricity mix are, in order, West Virginia, Maryland, Georgia, North Carolina and South Carolina, each with at least one-fifth of their in-state electricity generation coming from units that our analysis shows to be struggling economically. In West Virginia, 57 percent of statewide electricity generation comes from uneconomic units; the same is true for 33, 29, 24 and 22 percent of the electricity generation in Maryland, Georgia, North Carolina and South Carolina, respectively.

“The number of coal-fired power plants in our region that are uneconomic compared to natural gas, as well as wind power, shows that even in the Southeast, the time to transition away from coal has come,” said Amelia Shenstone with the Southern Alliance for Clean Energy (SACE). “Renewable energy sources, including large quantities of reliable wind power transmitted from the Plains, are ready for prime time and can save money over older coal plants.”

Without forward-looking policies, coal plant closings could result in some states becoming overly reliant on natural gas. Natural gas prices are historically volatile, posing risks to consumers’ pocketbooks. Furthermore, cutting carbon emissions at a pace needed to meet our climate goals and limit the worst impacts of climate change requires limiting our dependence on natural gas, which still produces carbon emissions when burned. As a result, natural gas infrastructure built today could be under-utilized or even abandoned before it is paid off. According to a previous UCS analysis, “Rating the States on Their Risk of Natural Gas Overreliance,” in eight states natural gas already makes up more than half of the energy mix and 16 states—including Georgia and North Carolina—are at high risk of natural gas overreliance.

“In states where a large portion of the existing coal fleet is likely to be shuttered, a wholesale shift from one fossil fuel to another puts consumers at risk,” said Sam Gomberg, senior energy analyst at UCS and co-author of the analysis. “In Florida, for example, natural gas has become the de-facto substitute for retired coal and already makes up the majority of the state’s electricity mix. This could cost consumers dearly in the form of price spikes or obsolete infrastructure. Instead, states should be seeking to take advantage of the opportunity to diversify their energy mix with renewables, energy efficiency, and emerging technologies such as battery storage and smart meters.”

EPA Administrator Scott Pruitt is expected to announce today that he will roll back the Clean Power Plan with no clear plan or timeline for replacing it. This move will undermine the goals of the Clean Power Plan, which were aimed at reducing U.S. power sector global warming emissions. The Trump administration is also attempting to put its thumb on the scale to override current electricity sector market realities. Department of Energy Secretary Rick Perry has proposed new rules that would provide potentially unlimited funding for struggling power plants regardless of their economic competitiveness compared to cleaner alternatives. The idea is to prop up outdated and uneconomic coal and nuclear plants—even if better, cheaper, and cleaner alternatives exist—and pass the costs on to ratepayers.

“What happens to the remainder of the coal fleet could have significant implications not only for the millions of people still living in communities near coal-fired power plants, but also for people living further away who will still feel the impacts of pollution from these plants,” said Julie McNamara, energy analyst at UCS and report co-author. “Ensuring public health benefits are realized by communities neighboring coal plants, and that worker transition assistance reaches coal-dependent areas to help diversify their economies, is crucial. States and regions need to be prepared for this next wave of coal retirements and devise a plan with local community members on how to replace this lost coal generation in a way that will benefit everyone.”

“Our analysis makes it clear the transition away from coal continues, making additional waves of coal retirements inevitable,” said Richardson. “It’s long past due for Congress and President Trump’s administration to set aside the false promise that discarding, slowing down or weakening environmental safeguards will bring back reliable coal jobs. Instead, they should focus on supporting real, innovative solutions that can bring about tangible, economic development in coal-reliant communities like transforming retired coal plants, retraining coal workers and diversifying the local economy. A just transition to a clean energy economy is vital for U.S. communities and necessary to for global efforts to address climate change.”

To view state and coal unit data, click here.

Study Reveals Measurable Improvement in Sustainability Reporting Among Top Global Companies.

Image credit: WBCSD

Geneva/London/Mexico City: Spanning 157 leading companies from more than 20 sectors and 35 countries, this year’s research points to positive progress in corporate reporting and disclosure as well as a continued movement towards digital reporting.

74% of WBCSD member company reports reviewed improved their overall score compared to baseline year 2013, despite pressure to strike the balance between stakeholder needs and increased disclosure requirements.

Despite progress, however, companies still face increased pressure to report on a growing number of disclosure requirements, while also meeting the needs of a wider variety of key stakeholders. Companies must find ways to meet the challenge, making sure all reported information is concise and meaningful.

Reporting matters helps companies meet the challenge by providing good-practice examples as well as general trends and benchmarks over the past five years. This is particularly useful to business because insights can be shared across sectors for collective improvement.

This year’s report also provides insight into the new Task Force on Climate-related Financial Disclosures (TCFD) recommendations, WBCSD’s new collaborative work on risk management with COSO, the expanding universe of disclosure requirements and updates on the status of human rights and Sustainable Development Goals (SDGs) reporting.

Key findings from Reporting matters 2017 include:

74% of member company reports reviewed have improved their overall score in our benchmark compared to baseline year 2013.

44% go beyond a traditional PDF report and include online content – up from 23% in 2014 when we started tracking this data accurately.

79% acknowledge the Sustainable Development Goals (SDGs) in some way

34% combine financial and non-financial information, up from 23% in 2013. 22% specifically cite the International Integrated Reporting Framework.

The Global Reporting Initiative (GRI) is still the most widely used set of reporting guidelines and standards. 85% of member company reports reviewed cite the GRI Guidelines or the new Standards. 18% have already transitioned to the new GRI Standards.

27% note that executive compensation is tied to sustainability metrics in some way, but only five companies provide specific percentages.

Peter Bakker, CEO and President, WBCSD, said: “This year’s Reporting matters shows that there is clear progress towards transformative change that will be an essential part of delivering the Sustainable Development Goals. We see the trend toward online and integrated reporting is moving non-financial reporting further into the mainstream – positioning sustainability at the heart of corporate governance, financial and risk management. This is a positive lever to scale up impact and make more sustainable companies more successful.”

Louise Ayling, Senior Sustainability Consultant at Radley Yeldar, said: “We’re excited about the theme of this year’s Reporting matters, which for the first time shines a spotlight on the challenges companies face while trying to navigate the competing needs of multiple stakeholders. We highlight the importance of addressing new disclosure requirements such as TCFD and demonstrating tangible progress towards the SDGs. At the same time, Reporting matters acknowledges the increasing demand for engaging sustainability content by a wider variety of audiences, across broader channels, such as online and integrated reporting. It’s a challenge we’ve addressed by updating the Experience criteria this year.”

Reporting matters will continue into 2018 and beyond as WBCSD and its member companies work to improve corporate reporting on the road to a sustainable future.

How Much Water Flows Into Agricultural Irrigation?

Farms are common along the North Fork of the Republican River near Wray, Colorado. Image credit: Wikimedia Commons/Jeffrey Beall

National Science Foundation, USA: Irrigation for agriculture is the largest use of fresh water around the globe, but precise records and maps of when and where water is applied by farmers are difficult to locate. Now a team of researchers has discovered how to track water used in agriculture.

In a paper published in the journal Geophysical Research Letters, the researchers detail their use of satellite images to produce annual maps of irrigation. The findings, the scientists said, will help farmers, water resource managers and others understand agricultural irrigation choices and make better water management decisions.

“We want to know how human activities are having an impact on the environment,” said hydrogeologist David Hyndman of Michigan State University (MSU), principal investigator of the project. “Irrigation nearly doubles crop yields and increases farmer incomes, but unsustainable water use for irrigation is resulting in depletion of groundwater aquifers around the world. The question is: ‘How can we best use water?”

The paper highlights the need to know when and where irrigation is occurring to effectively manage water resources.

The project focuses on an economically important agricultural region of the central U.S.–the Republican River Basin–that overlies portions of Colorado, Nebraska and Kansas, and provides surface water and groundwater to the High Plains Aquifer. The team found that irrigation in this area roughly doubled between 2002 and 2016.

Water use in this region can be complicated because it is regulated to preserve stream flow into Kansas in accordance with the Republican River Compact of 1942.

“Previously, we knew what farms were equipped to irrigate, but not which fields were actually irrigated in any particular year,” said Jillian Deines, also of MSU and the paper’s lead author. “Our irrigation maps provide this information over 18 years and can be used to understand the factors that contribute to irrigation decisions.”

The researchers used Google Earth Engine, a cloud-computing platform that makes large-scale satellite and environmental data analyses available to the public, to quantify changes in irrigation from year to year–an important finding for farmers, crop consultants and policymakers working to improve the efficiency of irrigation.

Google Earth Engine has been an asset for computing the large number of satellite images needed, the scientists said. “It allows researchers to use consistent methods to examine large regions through time,” Deines said.

More than 9,000 Landsat images provide vegetation health metrics for the Republican River Basin. Image credit: David Hyndman

The project, which also involves MSU research associate Anthony Kendall, is supported by the joint National Science Foundation (NSF)-USDA National Institute of Food and Agriculture (NIFA) Water, Sustainability and Climate (WSC) program and the joint NSF-NIFA Innovations at the Nexus of Food, Energy and Water Systems (INFEWS) program.

“Knowing what to plant, how much land to plant, and how much irrigation water is necessary to support a crop through harvest has been a challenge for farmers throughout time,” said Tom Torgersen, NSF program officer for WSC and INFEWS. “Farmers can now envision a future where models will provide options to help guide decisions for greater efficiency and crop productivity.”

Program managers at USDA-NIFA said that demand for agricultural products will likely increase in the future, while water for irrigation may decrease due to water quality issues and competitive uses.

The Republican River Basin researchers “leveraged new computing power to handle the ‘Big Data’ of all available Landsat satellite scenes, and developed irrigation maps that help explain human decisions about irrigation water use,” said Jim Dobrowolski, program officer in NIFA’s Division of Environmental Systems. The maps hold the promise, he said, of the ability to make future water use predictions.

Electric Vehicles: Will Metal Supplies Limit Battery Expansion?

A new analysis indicates that, without proper planning, there could be short-term bottlenecks in the supplies of some metals, particularly lithium and cobalt, that could cause temporary slowdowns in lithium-ion battery production. This map shows today’s trade flows of key ingredients for battery production, with exports from each country shown in red and imports in green. Image credit: MIT

Massachusetts Institute of Technology: The dramatic rise in production of electric vehicles, coupled with expected growth in the use of grid-connected battery systems for storing electricity from renewable sources, raises a crucial question: Are there enough raw materials to enable significantly increased production of lithium-ion batteries, which are the dominant type of rechargeable batteries on the market?

A new analysis by researchers at MIT and elsewhere indicates that for the near future, there will be no absolute limitations on battery manufacturing due to shortages of the critical metals they require. But, without proper planning, there could be short-term bottlenecks in the supplies of some metals, particularly lithium and cobalt, that could cause temporary slowdowns in production.

The analysis, by professor Elsa Olivetti and doctoral student Xinkai Fu in MIT’s Department of Materials Science and Engineering, Gerbrand Ceder at the University of California at Berkeley, and Gabrielle Gaustad at the Rochester Institute of Technology, appears in the journal Joule.

Olivetti, who is the Atlantic Richfield Assistant Professor of Energy Studies, says the new journal’s editors asked her to look at possible resource limitations as battery production escalates globally. To do that, Olivetti and her co-authors concentrated on five of the most essential ingredients needed to produce today’s lithium-ion batteries: lithium, cobalt, manganese, nickel, and carbon in the form of graphite. Other key ingredients, such as copper, aluminum, and some polymers used as membranes, are considered abundant enough that they are not likely to be a limiting factor.

Among those five materials, it was quickly clear that nickel and manganese are used much more widely in other industries; battery production, even if significantly increased, is “not a significant part of the pie,” Olivetti says, so nickel and manganese supplies are not likely to be impacted. Ultimately, the most significant materials whose supply chains could become limited are lithium and cobalt, she says.

For those two elements, the team looked at the diversity of the supply options in terms of geographical distribution, production facilities, and other variables. For lithium, there are two main pathways to production: mining and processing of brines. Of those, production from brine can be ramped up to meet demand much more rapidly, within as little as six or eight months, compared to bringing a new underground mine into production, Olivetti says. Although there might still be disruptions in the supply of lithium, she says, these are unlikely to seriously disrupt battery production.

Cobalt is a bit more complex. Its major source is the Democratic Republic of the Congo, which has a history of violent conflict and corruption. “That’s been a challenge,” Olivetti says. Cobalt is typically produced as a byproduct of other mining activity. “Often a mine’s revenue comes from nickel, and cobalt is a secondary product,” she says.

But the main potential cause of delays in obtaining new supplies of the mineral comes from not its inherent geographic distribution, but the actual extraction infrastructure. “The delay is in the ability to open new mines,” she says. “With any of these things, the material is out there, but the question is at what price.” To guard against possible disruptions in the cobalt supply, she says, researchers “are trying to move to cathode materials [for lithium-ion batteries] that are less cobalt-dependent.”

The study looked out over the next 15 years, and within that time frame, Olivetti says, there are potentially some bottlenecks in the supply chain, but no serious obstacles to meeting the rising demand. Still, she says, “it’s important for stakeholders to be aware of the bottlenecks,” as unanticipated supply disruptions could put some companies out of business. Companies need to think about alternative sources, and “know where and when to panic.”

And understanding which materials are most subject to disruption could help guide research directions, in deciding “where do we put our development efforts. It does make sense to think of cathodes that use less cobalt,” Olivetti says.

Overall, she says, “in most cases there are reasonable supplies” of the critical materials, “but there are potential challenges that should be approached with eyes wide open. What we tried to present is a framework by which to think about these challenges in a bit more quantitative way than you usually see.”

[The work was supported by the National Science Foundation, USA].

Amazon Launches Biggest Wind Farm Yet

Representative Image

Texas: Amazon today announced that its largest wind farm yet—Amazon Wind Farm Texas—is now up and running, adding more than 1,000,000 MWh of clean energy to the grid each year. Amazon has launched 18 wind and solar projects across the U.S., with over 35 more to come. Together, these projects will generate enough clean energy to power over 330,000 homes annually. These projects also support hundreds of jobs and provide tens of millions of dollars of investment in local communities across the country.

Amazon Wind Farm Texas includes more than 100 turbines – each over 300 feet tall with a rotor diameter more than twice the wingspan of a Boeing 787. Amazon Wind Farm Texas is built, owned, and operated by Lincoln Clean Energy (LCE), an I Squared Capital portfolio company and a leading developer of wind and solar projects across the U.S. Amazon, LCE, and local officials and residents celebrated the grand opening of the wind farm with a BBQ event onsite. To thank and support the local community, Amazon is donating $50,000 to the Snyder Education Foundation to provide students and teachers with STEM learning opportunities.

“Investing in renewable energy is a win-win-win-win – it’s right for our customers, our communities, our business, and our planet,” said Kara Hurst, Amazon’s Worldwide Director of Sustainability. “We now have 18 wind and solar projects across the U.S. with more than 35 projects to come. These are important steps toward reaching our long-term goal to power our global infrastructure using 100% renewable energy. We’d like to thank the leaders at LCE, the Scurry County community, and our partners across the country who are helping us continue to bring new renewable energy online.”

“I applaud Amazon’s leadership in supporting renewable power. Corporations like Amazon have become a major force in the transition to renewable power, and with their involvement, we look forward to producing power in Scurry County for years to come,” said Declan Flanagan, founder and CEO of LCE.

“Scurry County has long been a hub for the energy industry and we’re excited to expand our commitment to wind power generation with Amazon and LCE. The wind industry has boosted the Texas economy with jobs, revenue to area landowners, and property taxes that support our schools,” said Scurry County Judge Ricky Fritz.

In addition to its investment in renewable energy, Amazon’s commitment to sustainability includes innovations like Frustration-Free Packaging programs, which eliminated more than 55,000 tons of packaging last year, the District Energy system at its HQ in Seattle that heats more than 3 million square feet of office space using recycled heat from a nearby non-Amazon data center, and more. You can learn about Amazon’s sustainability and environmental work at www.amazon.com/sustainability.

Pollution Levels in Delhi-NCR High after Diwali

Delhi – a day after Diwali 2017

New Delhi (CSE) – An analysis by Centre for Science and Environment (CSE) has shown that despite the cracker ban, air pollution levels breached the emergency standards on Diwali night. But it is also clear that without the ban on sale of firecrackers, the levels would have been far worse. Calm wind and more moisture in the air on the post-Diwali morning worsened the pollution build-up.

Releasing the analysis, Anumita Roychowdhury, Executive Director- Research and Advocacy, CSE, said: “It is clear that the Delhi-NCR region requires a longer term and systemic action than a one-off ban. The Supreme Court has already ordered a phase down strategy with the help of regulation of chemicals, standards, reduced quantum of crackers, controlled bursting of crackers through community events, locational controls etc. This must be implemented without delay for a longer term solution to the problem.”

“Delhi and NCR cannot continue to remain on emergency mode all the time to address this public health crisis. This demands longer term strategy to control pollution from continuous sources, including motor vehicles and industry, while curbing episodic pollution from firecrackers and farm fires. A comprehensive action plan must combine short and long term strategies for vehicles, industry, waste burning and construction activities for more sustained and longer term gains,“ she added.

The key highlights of the air quality analysis are as follows:

CSE tracked hourly data from about 13 air quality monitoring stations of the Central Pollution Control Board, Delhi Pollution Control Committee and India Meteorological Department to track the changes in air quality during Diwali. The findings are indicative as this analysis faced data quality challenges. For instance, the Mandir Marg station is showing a constant reading from 12 pm onwards. Siri Fort, on the other hand, has stopped giving data since yesterday. Punjabi Bagh and ITO have stopped giving data since 12 pm, while data for R K Puram is not available from midnight to 3 am in the morning. Also data for Faridabad is not available since 10 pm of October 19. Moreover, direct comparison with 2016 Diwali has been difficult as data from all stations are not available for both the years. Here are some key highlights:

Hits emergency level: Despite the cracker ban the 24-hour average level of PM2.5 during Diwali and the morning after (12 pm – 12 pm, October 19-20) has been 397 microgramme per cubic metre (mg / cu m). This is 6.6 time higher than the standards and are at emergency level. This is more than two times higher than the levels during pre-Diwali day when the 24 hour average was 184 microgramme per cu m.

Direct comparison with 2016 Diwali has not been possible due to lack of data from all comparable monitoring stations.

Pre-Diwali level this year much cleaner than previous year: This year pre-Diwali pollution has been lower than the pre-Diwali pollution of 2016. Last year the pre-Diwali pollution had already hit the severe level (4.9 times the standard) whereas this year it remained within very poor category (2.9 times higher than the standard). Other steps including closure of Badarpur Power Station and conventional brick kilns and stronger action on trucks etc as part of the graded response action plan contributed to this trend.

Night time pollution three to four times higher than day time pollution in Delhi and NCR town: Night time pollution in Delhi and NCR towns has been three to four times higher than the day time pollution on Diwali day. During the day (about 13 hour average – 6 am to 7 pm) the levels in Delhi and NCR town of Gurugram and Gaziabad were in very poor category (Delhi – 139 microgramme per cu m; Gurugram -121 microgramme per cu m; and Gaziabad -142 microgramme per cu m). However, during Diwali night (about 12 hour average – 7PM to 7AM) the levels in Delhi, Gurugram and Gaziabad were in emergency level. (Delhi- 548 microgramm per cu m; Gurugram – 382 microgramme per cu m; Gaziabad – 501 microgramem per cu m).

SO2 levels increased dramatically during the night of Diwali (10pm- 3am): The SO2 levels that otherwise remain very low in the region increased by more than three times in several locations including RK Puram, Shadipur and Punjabi Bagh. During pre-Diwali (October 17-18) the SO2 levels in Delhi were less than 50 microgramme per cum. But on Diwali night the hourly levels increased alarmingly to 183 microgramme per cum. This is a direct indicator of impact of Diwali crackers.

The emergency condition has prevailed until 10am on October 20: The levels have started to decrease thereafter but are still in ‘severe’ category. Many stations have observed peaking of pollution i.e., Shadipur, DTU, Dwarka, Lodhi road, RK Puram, North campus, CRRI Mathura road where the hourly levels have stayed above the mark of 500-1100 microgramme per cum between 12am to 6am.

Overall, since October 1, PM2.5 levels have remained at poor level until October 7. Thereafter, it increased to very poor category. This also coincides with the starting of farm fires. However, on Diwali night and the morning after the region has experienced severe and emergency level.

Fiji Launches First Emerging Market Green Bond and Third in World

COP 23- FIJI: Fiji has become the first emerging market to issue a sovereign green bond, raising 100 million Fijian dollars, or US$ 50 million, to support climate change mitigation and adaption.

Home to over 870,000 people, Fiji’s 300 volcanic islands include low-lying atolls that are highly susceptible to cyclones and floods. In 2016, Tropical Cyclone Winston—the most intense tropical cyclone in the Southern Hemisphere on record—passed directly over Fiji, causing economic losses that amounted to almost one third of the country’s GDP. Like all Pacific island states, Fiji is also highly vulnerable to the impact of climate change: close to 20 percent of the region’s 10 million people could be displaced due to climate change by 2050.

Green bonds are fixed income, liquid financial instruments that are used to raise funds dedicated to climate-mitigation, adaptation, and other environment-friendly projects. This provides investors an attractive investment proposition as well as an opportunity to support environmentally sound projects.

At the request of Fiji’s Reserve Bank, the World Bank and the International Finance Corporation (IFC), a member of the World Bank Group focusing on private sector, provided technical assistance to assist the government in issuing a sovereign green bond. This collaboration took place under a broader, three-year Capital Markets Development Project supported by the Australian Government. Through this partnership, Australia and IFC are helping stimulate private sector investment, promote sustainable economic growth and reduce poverty in the Pacific.

Projects financed from the Fiji green bond will follow the internationally developed Green Bond Principles, and will focus primarily on investments that build resilience against the impacts of climate change. Sustainalytics US (Sustainalytics), a provider of environmental, social and governance research and analysis, evaluated Fiji Sovereign’s green bond transaction and its alignment with the Green Bond Principles. Fiji will also use bond proceeds for projects supporting its commitment to achieve 100% renewable energy and reduce its CO2 emissions in the energy sector by 30% by 2030.

Fijian Prime Minister and President of COP23 Frank Bainimarama said: “The Fijian people, along with every Pacific Islander, live on the front lines of climate change. The rising seas, changing weather patterns and severe weather events are threatening our development, our security and the Fijian way of life, along with the very existence of some of our low-lying neighbors. I have made access to climate finance a key pillar of our upcoming COP23 Presidency, and we are proud to set an example to other climate-vulnerable nations by issuing this green bond to fund our work to boost climate resilience across Fiji. By issuing the first emerging country green bond , we are also sending a clear signal to other nations that we can be creative and innovative in mobilizing funds and create win-win outcomes for countries and investors in adapting to the serious effects of climate change.”

“With this bond, Fiji has demonstrated that green capital markets can be created in emerging economies, and that all countries, big and small, have an important role to play in facilitating climate solutions,” World Bank Group President Jim Yong Kim said. “As it takes the helm of COP23, Fiji is uniquely positioned to inspire other countries to meet their respective targets and build resilience against climate change.”

The World Bank and IFC are among the pioneers of the green bond market. The World Bank issued the first green bond in 2008. Since then, both institutions have provided leadership by issuing green bonds across a range of currencies, tenors and volumes; helping to define best practice for reporting and standards; and working with countries to facilitate the development of domestic green bond markets. The global green bond market is expected to reach US$134.9 billion in 2017.

The Government of Fiji will chair the 23rd Climate Change Conference (COP23) in Bonn, Germany from November 6-17, 2017. Prime Minister Voreqe Bainimarama has given high priority to COP23 and aims to continue the momentum for action since the entry into force of the Paris Climate Change Agreement last year.

Fiji Green Bond Summary Terms and Conditions

Issuer: Government of Fiji
Amount: 100 million Fiji dollars
Pricing date: 1 November 2017 – May 2018
Settlement date: 1 November 2017 – May 2018
Maturity date: 1 November 2022 and 1 November 2030
Issue price: 100
Coupon: 5 years: 4.00%; 13 years: 6.30%
Denomination: Fiji Dollars

Dow Jones Sustainability Indices 2017 Review – Results Announced

London, New York, Zurich: The Dow Jones Indices (S&P DJI) and RobecoSAM, today announced the results of the annual Dow Jones Sustainability Indices (DJSI) review. Among the three largest additions and deletions (by free-float market capitalization) to the DJSI World include-

Additions:

Samsung Electronics Co., Ltd.,
British American Tobacco p.l.c.,
ASML Holding N.V.

Deletions:

Enbridge Inc.,
Reckitt Benckiser Group plc,
Rio Tinto plc.

However, Enbridge Inc. remains a member on the DJSI North America, and Rio Tinto plc remains a member of DJSI Europe – the regional indices.

Launched in 1999, the DJSI World represents the gold standard for corporate sustainability and is the first global index to track the leading sustainability-driven companies based on RobecoSAM’s analysis of financially material Environmental, Social, and Governance (ESG) factors and S&P DJI’s robust index methodology.

Every year, RobecoSAM assesses the world’s largest companies via its Corporate Sustainability Assessment (CSA), which uses a consistent, rules-based methodology to convert an average of 600 data points per company into one overall score. This score determines inclusion in the DJSI.

“Being a pioneer and a thought-leader in Sustainability Investing for over 20 years, we understand the right questions to ask in our CSA in terms of financially material sustainability aspects within the corporate world. This is what firms appreciate about the CSA. It brings them a big step ahead in terms of Corporate  Sustainability and with this– a big step ahead of their competitors – getting a coveted spot in the DJSI makes sure they continue to play in the premier league of companies.”

Manjit Jus, Head of Sustainability Application & Operations, RobecoSAM

“Many of the events witnessed so far in 2017 make it even more important for corporations around the globe to recognize sustainability, establish policies and manage their businesses in ways that support and increase the sustainability of the global environment and the world’s leading businesses. The DJSI family provide a tool for investors to create asset allocations that can further sustainability.”

David Blitzer, Managing Director and Chairman of the Index Committee, S&P Dow Jones Indices

This year, RobecoSAM’s CSA assessed Policy Influence for the first time to learn more about companies’ lobbying activities and expanded the Impact Measurement & Valuation criteria to nearly all industries. Preliminary analysis of the CSA data set for these criteria reveals that

Companies spend on policy influence

RobecoSAM perceives Policy Influence as a material issue for investors that deserves more attention from ESG and investment analysts. In situations where the revenues of public companies are larger than the GDPs of the countries in which they operate these companies may exert tremendous influence over the local political and legislative process. This creates risks and opportunities which are critical inputs into investment decisions.

Analysis of the CSA dataset reveals that companies in the DJSI assessment universe spend an average of 0.02% of total sales annually on policy influence activities (median spending is 0.01% of total sales). Another observation is that companies are hesitant to report on Policy Influence spend that goes beyond legal obligation.

Companies face difficulty assessing financial impacts

In light of the Sustainable Development Goals (SDGs) as set by the United Nations Development Programme in 2016, companies, governments and investors alike want to understand both the positive and negative externalities inherent in companies’ business models and how their products, services and operations contribute to, or detract from, the achievement of the SDGs.

Analysis of the CSA dataset shows that while the vast majority (70%) of companies are aware of the need to understand these types of environmental and social profits and losses, less than 10% of companies actually have a viable valuation approach in place today that provides detailed insights into these potential financial impacts.

For additional information on the DJSI and the changes to its components’ numbers, please visit: RobecoSAM’s DJSI review page and www.spindices.com/index-family/esg/djsi

Chevrolet Brings All-Electric Vehicle Technology from the Moon to Earth

2017 Bolt EV alongside a view of the Apollo 17 Lunar Rover Vehicle at Sample 8135, taken during Extravehicular Activity EVA 3. Image: GM

DETROIT: In July 1971, Apollo 15 astronauts explored the moon in the first electric-powered Lunar Rover, thanks to help from General Motors engineers. Fast-forward to the 2017 Chevrolet Bolt EV, and it’s clear once again that GM remains at the forefront of EV engineering. With an EPA-estimated range of 238 miles on a single charge and costing a fraction of the Lunar Rover’s $38 million price tag, the Bolt EV has made driving electric attainable for the Earth-bound.

The Rover was a textbook example of pushing the envelope of creativity. Working at light speed, GM, in cooperation with partner companies, developed, designed and tested the Lunar Rover. Engineers from GM helped create a revolutionary electric motor drive system, suspension, mesh wire wheels and a unique drive controller adapted for lunar gloves.

Project Chief Engineer Ferenc Pavlics and his team thought outside the box to solve challenges for both for astronauts and future EV customers. Almost 50 years after the project, Pavlics still remembers the innovation and commitment required to build an electric vehicle with unprecedented performance.

“When our team began engineering for the Lunar Rover, there were so many unknowns, including varied terrain, extreme temperatures and the effect of reduced gravity,” said Pavlics, now retired. “We pushed the boundaries of automotive technology and worked hand in hand with the astronauts on the vehicle’s design.”

Pavlics sees a connective thread between his work then and Chevrolet’s contemporary electric vehicles. Today, Chevrolet EVs have the advantage of finding new roads on Earth, but the team brings the same commitment to engineering cars such as the award-winning Bolt EV.

“The Bolt EV required a new architecture to upend the status quo on electric driving,” said Michael Lelli, vehicle Chief Engineer. “We drew on our deep electrification expertise to provide Chevrolet customers the first long-range, affordable electric car.”

The same innovative spirit that drove the company to engineer an electric vehicle for the moon lives on in the Bolt EV. Except today’s EV drivers don’t have to wear space suits.

Starting at an MSRP of $37,495 before federal tax incentives of up to $7,500 depending upon individual tax situation, the 2017 Bolt EV offers an EPA-estimated 238 miles of range on a single charge. Standard features include electronic precision shift, one-pedal driving, Regen on Demand™ steering wheel paddle, 10.2-inch-diagonal color touchscreen and an 8 year/100,000 mile battery and propulsion system limited warranty (whichever comes first, see dealer for details). The top-trim Premier model adds leather-appointed seats, front and rear heated seats, Surround Vision Camera, Rear Camera Mirror and more.

Corporate Sustainability

Innovations for Sustainability

View Points

Climate Science

Carbon Watch

Economy and Environment